
Looking to modernize your Hospital, Lab or Clinic?
Hospi is trusted across 25 Indian states for billing, EMR, lab reports, automations & more.
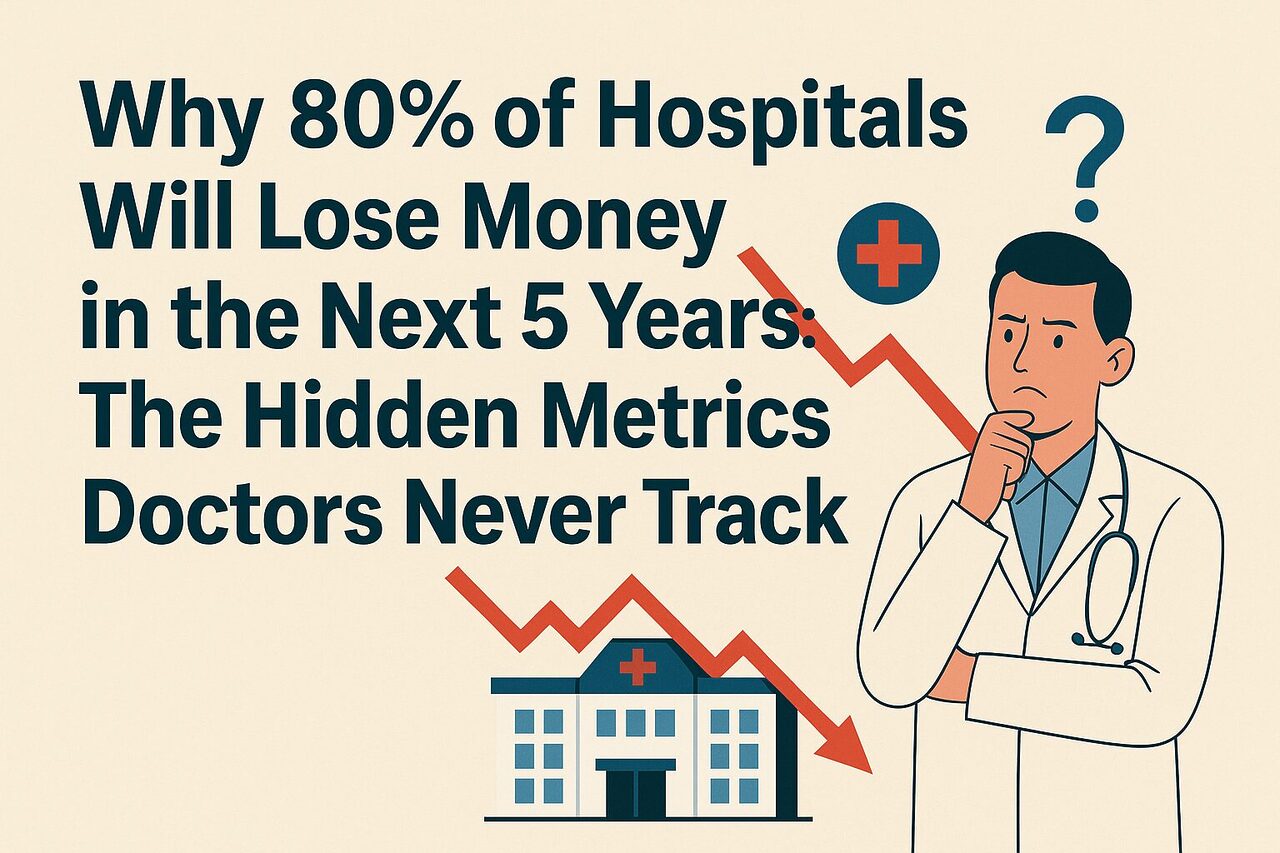
Introduction: The Silent Financial Hemorrhage
In the high-stakes world of healthcare, a dangerous paradox exists: hospitals are saving lives while their own financial health flatlines. Across continents, from American private networks to public NHS trusts in the UK, and from sprawling Indian corporate hospitals to under-resourced African clinics, a universal truth is emerging—clinical excellence no longer guarantees institutional survival. Industry analysts project that without a radical shift in management focus, up to 80% of hospitals globally could face operational insolvency or severe financial distress by 2030.
The root cause isn’t a lack of patients or medical skill, but a critical blindness to the hidden operational, financial, and experiential metrics that silently dictate profitability. While doctors meticulously track clinical outcomes, the business KPIs that keep the lights on often go unmonitored. This article is a global deep dive into the sophisticated, often-overlooked data points that separate thriving healthcare institutions from those on life support.
Section 1: The Global Landscape of Hospital Financial Pressure
Healthcare systems worldwide are navigating a perfect storm, though the specific pressures vary dramatically by region.
United States & The Value-Based Care Transition
The U.S. system grapples with the seismic shift from fee-for-service to value-based care. Here, profitability is increasingly tied to quality outcomes and cost containment, not just volume. Key hidden threats include:
- Skyrocketing administrative costs, which consume nearly 25-30% of total healthcare spending.
- Penalties for 30-day readmissions, where a single percentage point increase can cost a mid-sized hospital millions annually.
- Shrinking margins from private insurers demanding deeper discounts for bundled payments.
United Kingdom & The NHS Strain
The NHS faces existential budget constraints, with wait lists hitting record highs. For NHS trusts and private providers alike, efficiency is not a goal but a mandate. The hidden battle is for resource optimization—maximizing output from every pound. Key metrics here revolve around staff utilization, theatre efficiency, and reducing patient wait times from referral to treatment, which can stretch over 18 weeks for some specialties.
India & The Insurance Payout Quagmire
India’s booming private hospital sector is uniquely choked by cash flow volatility. A heavy reliance on Third-Party Administrators (TPAs) and insurance companies creates a critical lag. The average claim realization cycle stretches from 60 to 120 days, forcing hospitals to operate on unpredictable finances. Profitability hinges not on billing, but on collecting.
Africa & The Resource-Limited Innovation Imperative
Across many African nations, the challenge is twofold: extreme cost sensitivity and chronic under-investment in infrastructure. The hidden metric is asset utilization—ensuring every piece of equipment, from a CT scanner to a single ICU bed, generates maximum return to fund sustainability and expansion.
China & The Digital-First Demand
China’s rapidly modernizing system sees patients with high digital literacy and rising expectations. Hospitals compete not just on medical reputation but on digital patient experience—seamless app-based interactions, AI-powered triage, and integrated telemedicine. The hidden metric is digital engagement depth.
Table 1: Global Hospital Crisis Points & Key Hidden Metrics
| Region | Primary Financial Stressor | Most Critical Hidden Metric | Localized Benchmark (Healthy Target) |
|---|---|---|---|
| United States | Value-based care transition, high admin costs. | Cost-to-Charge Ratio (CCR) | Below 0.65 (65%) |
| United Kingdom | Budget caps, long wait lists. | Average Wait Time (Referral to Treatment) | Under 12 weeks |
| India | Delayed insurance payouts (60-120 days). | Claim Realization Time (CRT) | Under 45 days |
| Africa | Equipment financing costs, resource scarcity. | Diagnostic Machine Utilization Rate | >85% for core imaging |
| China | Patient demand for digital convenience. | Digital Appointment Conversion Rate | >25% |
| Russia | Public funding gaps, aging infrastructure. | Per Bed Operational Cost | Trending downward QoQ |
Section 2: The Foundational Financial Metrics Doctors Never See
Beyond standard P&L statements, these advanced metrics reveal the true economic engine (or anchor) of a hospital.
1. Average Revenue Per Occupied Bed (ARPOB): The Bedside Truth
Doctors see a full ward; financiers see a portfolio of assets. ARPOB reveals whether each asset is profitable.
- Calculation:
Total Inpatient Revenue / Total Occupied Bed Days. - The Blind Spot: High occupancy with low ARPOB means filling beds with low-margin, high-cost cases (e.g., fixed-price government scheme patients). The strategic move is to actively manage the case mix index.
- Advanced Analysis: Segment ARPOB by department (e.g., Orthopedics vs. Medicine). A world-class cardiology unit might have an ARPOB 300% higher than general medicine, guiding strategic investment.
2. The Cash Flow Chokehold: Claim Realization Time (CRT) & Net Collection Rate (NCR)
This duo determines if a hospital is a going concern.
- CRT is the average days from claim submission to cash receipt. In India, a CRT of 90 days versus 45 days can mean the difference between investing in new technology and taking high-interest working capital loans.
- NCR is the ultimate truth-teller:
(Payments Collected / (Total Charges – Contractual Adjustments)). An NCR below 90% indicates systemic issues in coding, billing, or payer negotiation. For a ₹500 crore hospital, a 5% drop in NCR means ₹25 crore evaporates.
3. Revenue Leakage: The Death by a Thousand Cuts
This is the silent killer, often amounting to 3-7% of total revenue loss. Sources are insidious:
- Unbilled Services: Minor procedures or consumables not recorded at the point of care.
- Contractual Non-Compliance: Failing to bill for all items allowed under insurer agreements.
- Discount Abuse: Unauthorized or unrecorded discounts given at the front desk.
- Advanced Detection: Requires interdisciplinary audits comparing nursing notes, pharmacy logs, and supply chain data against final bills.
Section 3: Advanced Operational Efficiency KPIs
1. Operational Theater (OT) Utilization: The Profitability Engine
The OT can contribute over 60% of a hospital’s revenue but is often grossly mismanaged. True utilization isn’t just scheduled hours; it’s productive hours.
- World-Class Benchmark: >70% productive utilization.
- The Hidden Layers:
- First-Case Start Delay: A 30-minute daily delay across 10 OTs wastes 1,250 hours annually.
- Turnover Time: The minutes between surgeries. Reducing this from 45 to 30 minutes can add one extra major surgery per OT per week.
- Technology Leverage: RFID-tagged instrument trays and AI-powered scheduling can boost utilization by 15-20%.
2. The Staffing Paradox: Provider Utilization & Dependency
- Provider Utilization Rate: Measures the percentage of a doctor’s paid time spent on billable care. A rate below 70% indicates systemic inefficiencies in scheduling, support, or administrative burden.
- Doctor Dependency Ratio: A massive hidden risk. If >30% of revenue relies on 2-3 doctors, the hospital is one resignation away from crisis. The strategic metric is revenue concentration risk.
3. Patient Flow & Hidden Bottlenecks
- Average Length of Stay (ALOS): In a capitated payment model, ALOS is the direct determinant of cost. A 1-day reduction in ALOS for a 300-bed hospital can save billions in operational costs annually in a system like Japan’s.
- Diagnostic Turnaround Time (TAT): The time from test order to result availability. A long TAT for key tests like MRI or biopsies doesn’t just delay treatment—it increases ALOS and patient anxiety while the asset (the patient bed) sits idle.
Section 4: The Digital & Experiential Metrics Redefining Competition
Modern healthcare competition happens long before a patient walks in.
1. The Digital Funnel: From Click to Clinic
- Website-to-Lead Conversion: For every 10,000 website visitors, how many submit an inquiry? A rate below 1.5% indicates poor content or user experience.
- Lead-to-Appointment Rate: How many inquiries convert to booked appointments? This measures front-office effectiveness.
- Digital Engagement Score: Tracking app logins, telemedicine usage, and portal activity reveals patient stickiness and reduces acquisition cost.
2. The Silent Feedback: Operational Experience Metrics
- Patient No-Show Rate: A rate above 10% is a red flag, indicating scheduling failures, communication gaps, or financial barrier issues. Predictive analytics can flag high-risk no-shows for proactive intervention.
- Pharmacy Conversion Rate: In a hospital with an in-house pharmacy, <65% of OPD prescriptions filled on-site represents a major revenue leakage and missed compliance opportunity.
Table 2: The Tech-Enabled Hospital – Metric Tracking Solutions
| Hospital Challenge | Legacy Mindset | Data-Driven, Tech-Enabled Solution |
|---|---|---|
| OT Scheduling | Static, paper-based schedules leading to conflicts and idle time. | AI Dynamic Scheduling that factors in surgeon preference, case length history, cleaning time, and emergency capacity. |
| Revenue Leakage | Quarterly manual audits that find leaks months too late. | Real-Time Reconciliation Engines that compare EHR, inventory, and billing data continuously, flagging discrepancies within hours. |
| Patient Flow | Reactive management of bed bottlenecks. | IoT & Predictive Analytics using sensor data and historical patterns to predict discharge times and optimize bed allocation. |
| Claim Denials | Post-submission denial management, leading to 60+ day corrections. | AI-Powered Pre-Submission Scrubbers that check claims against payer rules in real-time before submission, boosting clean claim rates to >95%. |
Section 5: Building a Metrics-Driven Hospital: An Implementation Blueprint
Transforming into a data-aware institution is a cultural and technical journey.
Phase 1: The Diagnostic Audit (Months 1-2)
- Assemble a Cross-Functional “Metrics Team” including clinicians, finance, operations, and IT.
- Conduct a Data Readiness Assessment. Identify what data is already being captured but not analyzed (e.g., EMR timestamps, inventory logs).
- Pick 3 “Quick Win” Metrics to track initially (e.g., OT First-Case Start Delay, Pharmacy Conversion, Daily Revenue Cycle Dashboard).
Phase 2: System Integration & Baseline Establishment (Months 3-6)
- Invest in interoperability—middleware that can talk to your HMS, laboratory system, and finance software.
- Establish clear baselines for your key metrics. Avoid comparing to generic benchmarks initially; focus on internal improvement.
- Launch visualized dashboards in high-traffic areas (not just the CEO’s office). Transparency drives accountability.
Phase 3: Culture Shift & Advanced Analytics (Months 7-18)
- Tie a portion of departmental and leadership bonuses to operational KPIs, not just financial or clinical outcomes.
- Move from descriptive analytics (“what happened”) to predictive analytics (“what will happen”).
- Begin external benchmarking against anonymized peer groups to understand true competitive positioning.
Conclusion: The Prescription for Survival
The coming decade will witness a great divergence in global healthcare. The hospitals that thrive will be those that master the dual expertise of medicine and metrics. They will understand that a patient’s journey is also a data journey, and that every minute, rupee, dollar, or pound must be accounted for with precision.
The hidden metrics are the vital signs of the hospital itself. Monitoring them is no longer an administrative task—it is the core act of modern healthcare leadership. The institutions that learn to diagnose their own operational health with the same rigor they apply to patients will be the ones defining the future of medicine, from Boston to Beijing, from London to Lagos.
Start today. Pick one hidden metric. Measure it. Improve it. The path to saving your hospital begins with a single number.
Go to below link if you want to read FAQs on this topic
Want a quick walkthrough of Hospi?
We offer gentle, no-pressure demos for hospitals, labs & clinics.
Or call us directly: +91 8179508852